
Beware the Snap-down
The inverted yield curve upended several banks. What will the inevitable snap-down do?
1. Risk Management when the Yield Curve Dis-Inverts
The US Treasury yield curve has now been more inverted for longer than at any time since at least the early 1980s, or when measured proportionately, for even longer. The US is now one of 36 countries with inverted yield curves, as central banks globally fight inflation. It is often said that inverted yield curves predict recession, but in fact they predict (with confidence) falling rates. Sometimes, falling rates are associated with recession, but that need not always be the case.
The inverted yield curve in the US has already been blamed for the failure of Silicon Valley Bank and for difficulties elsewhere. It is not unusual for banks to fund themselves using short-dated deposits and to invest in longer assets. Maturity and term mismatches have been studied and mitigated for generations, and interest rate risks are not a new phenomenon. What may be less well understood, however, are the risks that can arise from a rapid dis-inversion of the yield curve and how standard risk measures can be misleading.
Yield curve inversions are inherently unstable. When the inversion unwinds, yields fall, and the yield curve reverts to its normal upward slope. Short-term yields fall the most, long-term yields fall by much less. The reshaping is called a snap-down. A snap-down can unfold quickly, and standard risk measures such as portfolio duration and convexity are likely to fail to adequately protect against risk.
The possibility of a yield curve snap-down is well known in the markets generally. The new Dodd-Frank Act Stress Tests, for example, include scenarios of much lower rates and with a yield curve that eventually (although not immediately) becomes positively sloped. The Treasury forward market projects that the curve will dis-invert within about 18-21 months. The history of snap-downs, however, suggests it may happen sooner and more violently than forward rates project.
Given these facts, and because simple measures of portfolio duration and convexity risk being unreliable, it is key that risk managers using more precise measurements: partial durations across the curve and, even more importantly, stress tests of larger changes in the yield curve. Because of the likelihood of a quick reshaping of the yield curve, because of how well-known these events are, and because of the potential failures of simple risk measures like duration and convexity, it would be tantamount to risk management malpractice not to take account of the potential for differential performance in a snap-down.
2. A Quick Look at Consumer Price Index (CPI)
Economically, the yield curve is declaring that the Federal Reserve’s interest hikes are approaching their end and that the war on inflation is being won. The yield curve is a prediction that the Fed is planning to pound inflation into the ground before it declares victory. The size and duration of the inversion suggests that the market has a high degree of confidence in that prediction. The yield curve shape today implies that the inflation war may have been won, but that the Federal Reserve hasn’t yet declared victory. If the market is wrong and inflation resurges, then yields may move higher.
What is the evidence on inflation in the US? The variability in different components means it’s not easy to disentangle or to compare to inflation rates in other countries. One reason is the importance of shelter in the US CPI (and the different ways that shelter enters inflation measurements in other countries). In the US, shelter enters the CPI through the rent of the primary residence and through Owners’ Equivalent Rent (OER). Because rents adjust slowly to housing prices, they don’t rise as fast when prices first rise but they can keep rising after housing prices have started to fall, as happens currently.
Investors are usually more interested in the most recent news, not on developments that happened months or years ago. The CPI, however, is now affected in part by the housing price rises of 2020-2022 rather than by the more recent declines in housing prices. For that reason, it can be helpful to set aside the shelter component of the CPI and look at CPI ex-shelter. The graph below is taken from data provided by the Federal Reserve Bank of St. Louis.

The graph shows that the run-up in the CPI ex-shelter ended in June of 2022. CPI ex-shelter has been almost flat since then: an increase of 2.2% over the last 12 months, and only 0.7% over the last 11 months. Now this is not to say that US inflation is necessarily over. The series are volatile and inflation rates in European nations remain higher. The suppressed levels of some of the US inflation data series may explain, however, the Federal Reserve’s “pause” on raising interest rates. And if inflation does not resume soon, the conditions are set for a realignment of interest rates and a reshaping of the yield curve.
3. The History of Yield Curve Inversions
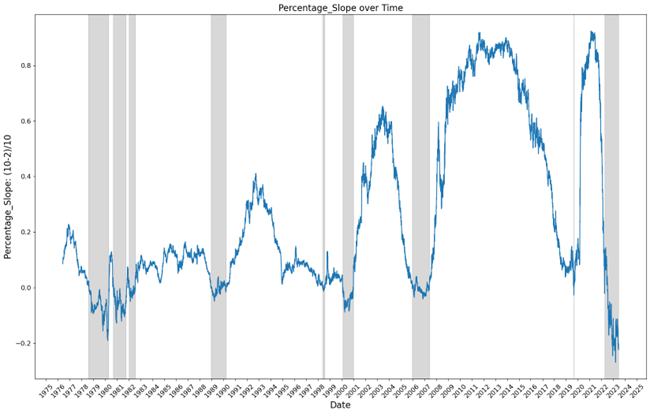
The yield curve is almost always upward sloping throughout history (and there are hundreds of years of data on interest rates.) When the yield curve becomes inverted, it is a market prediction that yields are going to fall and that the yield curve will revert to its normal positive slope: that is called a snap-down. From 1980s to June 2022, most inversions were followed by snap-downs about one year later. Today’s yield curve shape is a market prediction that a snap-down is likely to happen within the next year or so.

If we measure the inversion proportionately to the level of yields (rather than as an absolute basis point spread between the 10-year and the 2-year) the inversion is even more historic.
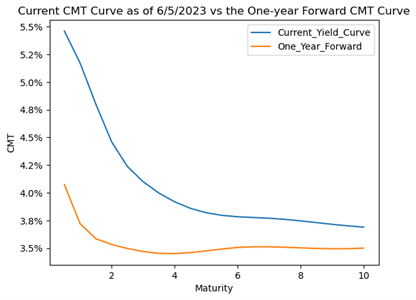
The current yield curve is experiencing such a significant inversion, that the one-year forward curve is inverted as well. The current inversion has already lasted a long time and forwards suggest it may continue for another year. Forwards are, of course, unreliable as a predictor of future rates and there is little assurance that the yield curve will still be inverted in a year. Based on historical data, even if the current forward curve is inverted, there remains a substantial possibility for a snap down in less than a year.
In the last 40+ years, there’re 586 days during which the 2-10s curve was inverted and inverted in one-year forwards as well. In only 37 of those days did the yield curve in fact stay inverted for a year. In all the other cases, the yield curve reverted to a positive slope within a year.

4. Differential Performance Across the Yield Curve in a Snap-Down.
The middle of the yield curve (the “body” of the curve) typically outperforms on a duration-matched basis the ends of the curve (a “barbell”) in a snap-down. The body of a 2-5-10 butterfly outperforms the wings. Historically, the outperformance can be substantial. But, until the snap-down happens, and in many other scenarios, the wings outperform the body.
The instability can be seen in the changing correlations between short and long maturities. As the yield curve changes shape, the correlations between the short and long maturities drop sharply. When the yield curve stays stable, the correlations stay high. When the yield curve first inverted, the correlation between the 2-year and 10-year Treasuries fell to historic lows. As the curve stayed inverted throughout the last year, the correlations rose again. When the snap-down finally happens, the correlations will decline once more.

5. Historical performance of butterfly strategy
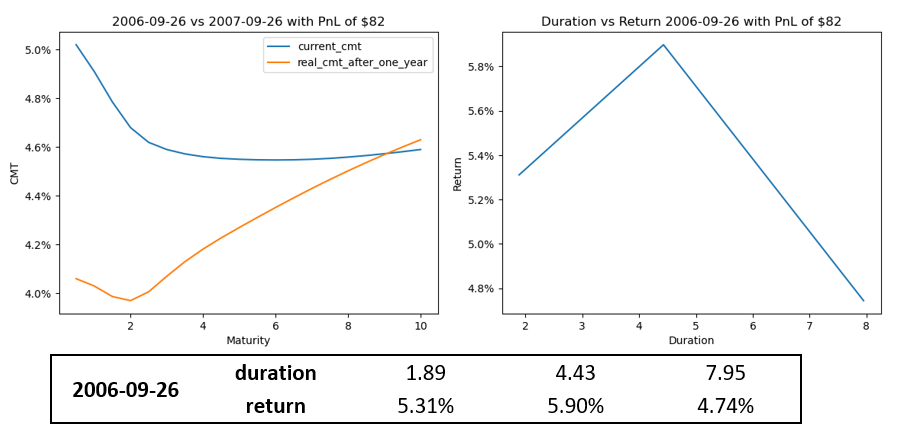
We examined the performance of the duration neutral butterfly strategy, i.e., long the body and short the wings, when the yield curve is inverted. To be specific, we fixed the shares of body (5-year CMT) to be 100 and adjusted the shares of wings (2-year and 10-year CMT) to ensure duration neutral and net zero market value. We assumed longs and shorts were at par and the coupons were determined by CMT index as of 6/5/2023. The prices of bonds after one year were calculated based on the actual CMT as well. We used cubic spline to interpolate the yield curve.

During inversion, the relationship between duration and return is non-linear. Here we listed three examples from the major inversion periods:
1981-09-01:

2000-11-22:

2006-09-26:
During the history from Sep 1981 to June 2022, we found each date with an inverted yield curve and then entered the duration-neutral fully invested strategy. We calculated the P&L one year later applying the coupon income and the bond price derived from the actual yield curve one year later. The result was that the body of a butterfly tended to perform better if the yield curve was inverted when the strategy was put on. The variation in performance and risk was substantial.


The implication is that yield curve strategies are likely popular today with investors and arbitrageurs and yield curve shape risks and returns are extraordinarily high.
6. Risk management in an unstable yield curve environment can be difficult.
An unstable yield curve environment or a yield curve snap-down is likely to cause significantly different performances across different tenors or maturities. The variation in future performance due to the reshaping of the yield curve likely causes investors and arbitrageurs to engage in strategies designed to take advantage of those future realignments. Those strategies are designed to increase the risk (and returns) attributable to a yield curve reshaping.
Yield curve strategies are therefore likely popular with investors and arbitrageurs because the returns (and risks) from yield curve reshaping are unusually high. One of the risk manager’s jobs is to accurately gauge the size of those potential risks and returns.
There are several key implications:
a. Simple portfolio-wide metrics intended to monitor risks such as duration and convexity are likely to be misleading. Measuring a single duration or convexity for a whole portfolio is inadequate because short tenors will perform far better than longer tenors and because, on a duration-weighted basis, the four-and-five year sectors may perform best of all. Risk should now be measured in different ways:
(1) Using partial durations at different terms: e.g., 2-year, 5-year, 10- and 30-years is helpful but,
(2) The drop in yields at short maturities may be large enough to create local convexity risks, and,
(3) The change in forward rates may not be intuitive, therefore,
(4) Stress tests and scenarios analyses of different future yield curves should now be a principal part of risk measurement.
b. The yield curve inversion has been going on for a long time now. Its very persistence can discourage the active risk investigation needed. Just because the snap-down hasn’t happened yet, doesn’t mean it isn’t going to happen and that it won’t be significant when it does.
c. Risk management of fixed rate mortgage portfolios can become more challenging than the measurements of duration and convexity would suggest. The bulk of the fixed rate market is far from being refinance-able at current levels of mortgage rates. There is significant protection against refinancing risk and that provides some justifiable comfort to mortgage investors. The inverted yield curve also provides comfort against extension risk. The mortgage market appears to be in a sweet spot. A quick and large snap-down has the potential to change things. It introduces the possibility of refinancing using ARMs and hybrid ARMs and it may even increase extension risk. While these are out-of-the-money risks, scenario analyses will be an effective way of measuring and thus managing those risks. Duration, convexity, and even partial duration measures are likely less effective than scenario analyses.
d. The performance of long-dated options on fixed income instruments can become counterintuitive, driven as they are by forward rates. Dramatic movements in short tenors are likely not going to be matched by equivalent changes in longer tenors. The different tenors of the options will cause great differentiation in performance. When intuition fails, modeling is needed.