
The Great (Disappearing) Recession: Adding Historical Data Desensitizes the Shock

Introduction
Lehman Brothers filed for bankruptcy on September 15, 2008 and the subsequent Great Recession reached its peak in 2009. Because these were the biggest and most stressful financial events of the last 80 years, historical data from 2008 and 2009 form the basis for much of today’s risk stress testing. However, as the intervening years push us further away from 2008 and 2009, the Great Recession’s impact on risk metrics can start to recede.
Most financial services companies use stress scenarios that are based on historical data. For example, the 99th percentile adverse move over a 10-day period is a common cut-off for the development of stress scenarios. Notably, such a stress scenario is by definition no more severe than the 99th percentile.
The 99th percentile stress is determined by ordering the observed 10-day periods within a historical data set by their stress losses. Over five years of data, there will be about 1,250 trading days and thus 1,250 different 10-day periods. The 99th percentile will capture the twelfth most stressful 10-day period within those five years of data, and there will have been 11 periods within the sample that were more stressful than the 99th percentile. Thus, while we may vividly remember the most stressful events during a given time period, the 99th percentile stress can in many cases be substantially less severe.
More subtly but critically important: adding data (i.e., extending the historical data set) tends to destress the 99th percentile scenario. Because the Great Recession was the biggest stress to many financial time series since the 1930s, adding more data has the effect of increasing the proportion of less stressful periods within the data set. The 99th percentile of a longer time series therefore typically represents a less stressful scenario than the 99th percentile of a shorter time series – assuming that both time series both capture the Great Recession.
S&P 500 Example
Let’s look at the S&P 500 index for example. The following chart shows the 99th percentile 10-day decline and worst 10-day decline for the S&P 500 index based on a rolling 5-year historical data set.[1]

Figure 1: Comparing the 99th percentile 10-day decline to the worst 10-day decline
We can see that the 99th percentile stress is in many cases substantially less stressful than the worst stress. The worst stress was almost twice as severe as the 99th percentile stress in many cases (for example, -14% vs. -26% on 1/1/2010).
Now if we add earlier data to make the data set bigger, the 99th percentile is likely to select less and less stressful periods. The impact of evaluating 10-year and 20-year rolling time periods of historical data is captured in the figure below. In both cases, expanding the evaluated data set greatly reduced the 99th percentile stress. For example, on 1/1/2010, the 99th percentile 10-day stress over the last 5 years was ‑14%. Over the last 10 years it was -12% and over the last 20 years it was -9%.
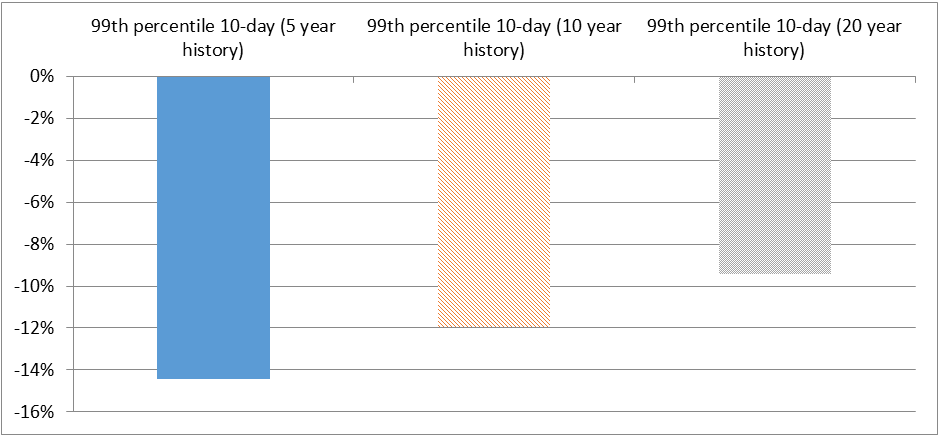
Figure 2: S&P 500 99th percentile stress losses as of January 2010 (evaluated for 5 year, 10 year, and 20 year historical data time series)

Figure 3: Evaluating stresses over a larger set of historical data mutes the impact of highly stressful events, like the Great Recession, and reduces the severity of stress scenarios
Conclusions
Using a 99th percentile cutoff is not unreasonable. In fact, using the worst period may in some cases be too stringent a standard. It is just worth remembering that when we do use the 99th percentile for evaluating stress scenarios, we are choosing a very specific event in history and it may not be exactly the same as the one that first comes to mind when you count the gray hairs on your head from having lived through that history.
Furthermore, lengthening the historical data set tends to make a 99th percentile cutoff less stressful. Because the most recent stresses (in 2008 and 2009) were so significant compared to earlier periods, adding earlier and less volatile data reduces the stress measured at the 99th percentile.
Stress testing is a great tool, but it risks being misleading if you don´t examine the fine print.
[1] For example, the 99th percentile 10-day decline of -14% on 1/1/2010 reflects the 99th percentile decline in the S&P 500 index over the immediately preceding 5 years (1/1/2005-1/1/2010).