
Using the VIX to Distinguish between Transitory and Persistent Risk
Dr. Peter Niculescu, CFA[1]
Capital Market Risk Advisors
New York, NY
Abstract
The volatility of the VIX Index has at times caused the impression that it is less than reliable as an indicator of risk. VIX futures and the volatility surface provide clearer information about the market perception of risk and should be used in conjunction with the VIX Index. The different movements of the VIX Index, VIX futures and of the volatility surface historically fall into four major categories that can be useful in understanding the level and length of equity market risk perceived in the options market.
The VIX Index, called the “Fear Index” receives considerable publicity as it gets linked to possible stock market declines[2]. The VIX Index is calculated from the implied volatilities of one-month options on the SPX.
I am occasionally asked how well the VIX links to actual equity market risk or, equivalently, to realized market volatility. It is the case that the VIX does at times spike and then quickly retreat and those times can give the impression that the VIX is unstable or driven by imbalances between the demand and supply of options rather than to the true risk of the equity markets.
The easiest response to the conjecture that the VIX is not a good gauge of true equity market risk is that options can be arbitraged against realized volatility. It is a frequent and time-honored practice to sell options (selling gamma) and to delta hedge as the market moves. The success or failure of that practice has involved skill, luck and persistence. But the fundamental link between implied and realized volatility is clear.
An historical examination of the volatility term structure provides a second response to the conjecture that the VIX is not a good gauge of true equity market risk. The volatility term structure lets us distinguish between the various types of risks faced by the market. Long-dated VIX futures can provide clearer information about the market’s perceptions of risk than the VIX Index. A single new and risky event may prove to be transitory, as demonstrated by a high VIX Index and steep backwardation in VIX futures.
In contrast, when 3-month to 9-month VIX futures are high, risk is likely to be a more important and long-lasting phenomenon rather than being due to transitory events or market dislocations. Large underlying fundamental forces driving risk and heightened volatility may take years to work through and the market responds with high VIX futures and a flat term structure. The focus on the VIX Index should be complemented by a focus on longer-dated implied volatilities and VIX futures.
It is helpful to categorize the different types of risk, as measured by the shape of the volatility term structure and by the longevity of high levels of implied volatility. In this paper, we distinguish between four different risk environments[3].
1. Classic Crisis:
a. Spike in short-duration option implied volatilities
b. Significant backwardation
c. Heightened volatility of volatility
d. Lasts a few months.
2. Transitory:
a. Spike in short-duration option implied volatilities
b. Significant backwardation
c. Ends in days or weeks
3. Continuing High Volatility:
a. High implied volatility of longer-dated options
b. Implied volatility remains high for several years
c. Implied volatility term structure is fairly flat, neither pronounced backwardation or contango
4. Tranquility:
a. Low implied volatility
b. Contango in implied volatility
The history of the VIX (and the VXO[4] before 1990) showed one spike in October 1987 that dwarfed everything else. That spike was short-lived.
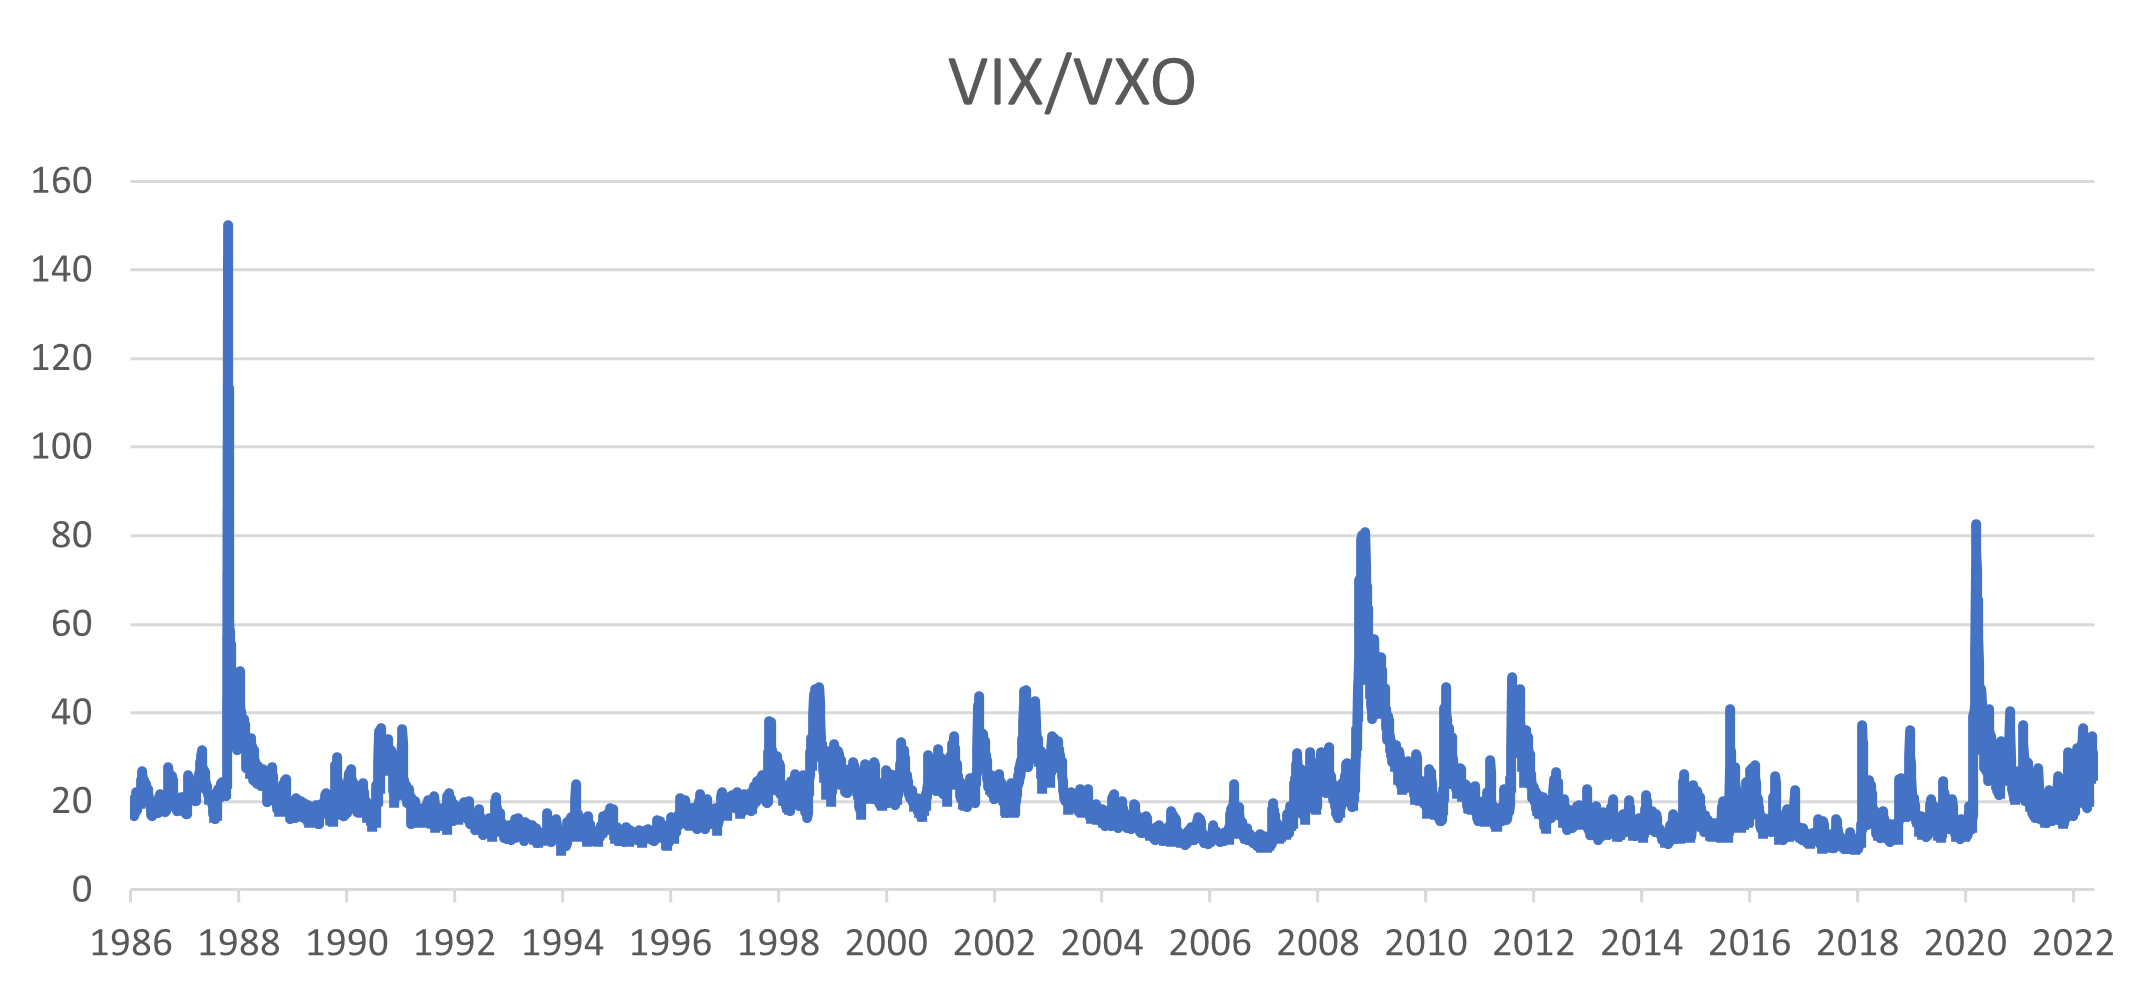
Focusing on the history from 1990 shows two similar spikes, late 2008 after the Lehman bankruptcy when the integrity of the financial system was in question, and March 2020 when Covid first hit. Both also saw extended periods of high volatility.

There were several periods of spikes amid periods of elevated risk: the real estate and banking crisis of 1990, the financial crises of 1998, the bursting of the tech bubble in the early 2000s, the dollar crisis of 2010 and the US credit downgrade in 2011. Each of those times saw elevated risk and volatility lasting for months with spikes from time to time.
In contrast to the crises were the extended times of stability: from 1991 to 1997, from 2003 to 2007 and again from 2012 to 2019 the VIX was low and, with the exception of very short-lived spikes, stayed low for years on end.
There were also several smaller, transitory spikes. The spikes in February 2018 and December 2018 are notable. In February 2018, in an episode that became known as “Volmageddon”, the implied volatility market experienced substantial intraday moves that persisted only for days and were quickly reversed.

The difference between the short-lived spikes and the times of extended risk can also be seen in the term structure of the VIX futures. The VIX is an index while VIX futures can be traded. The most commonly followed VIX variants are the VIX Index and the one-month future, the UX1. To no surprise, they track closely but the VIX Index itself can be a little more volatile at extreme moments.

At times when volatility spikes, VIX futures tend to move to backwardation: near term implied volatilities are higher than those further in the future. In normal times, the future trades at a slightly higher price than the index, called contango, but when the index spikes, the future can be left behind.

The spike in late 2008 was a prominent example. The significant increase in implied volatility in late 2008[5] to as high as 80% was unsustainable. The futures term structure correctly predicted that the VIX index would fall but continue at historically elevated levels close to 40%.

The short-lived spikes since 2008 also stand out as moments when the VIX Index overstated likely volatility over even a very short horizon. Pronounced risk over a longer horizon can be gauged by looking at longer futures. Going six months out from the front month future to UX7 shows a different pattern and one that more reliably indicates the level of elevated risk assessed by market participants to be more than transitory.

Longer-dated futures tell a different story than told by the VIX index. The crisis of 2008 saw the largest risk in late 2008 and 2009, with further smaller events in 2010 and 2011. The entire period from 2007 through 2011 was one of continued high risk. In stark contrast, from 2013 to 2019, risk was comparatively low.
From the start of Covid in 2020 to date, risk has been high. In fact, there is little difference in longer-dated risk perceptions today from their Covid levels in early 2020. Be it due to the supply chain problems, inflation, Fed rate and balance sheet policies or geopolitical risk, the risk levels today are higher than 2007 and comparable to 2010-12.
Both 2009 and the current market have similar patterns of high long-dated implied volatilities and a flat volatility term structure. Risks are not perceived to be related to near-term events but instead to forces that may take months to work through.

We can therefore assign a category to each risk event of the last 35 years.
1. Classic Crisis: 1990-1991, 1998, 2001-2002, 2008, 2020
2. Transitory: 1987, 1994, 2015, 2018
3. Continuing High Volatility: 1997-2003, 2007-2012, 2020-2022
4. Tranquility: 1988-1989, 1991-1997, 2003-2007, 2012-2019
Examining the recent period more closely reveals another significant development: the change in skew. Skew[6] dropped dramatically as at the money volatility increased, and as at the money volatility dropped off, skew went back up. The relationship is strong even if not precise.

As at-the-money volatility rises, out-of-the-money volatility, previously a 50-70% higher than at-the-money, drops down to a lower percentage. Out-of-the-money implied volatility appears to resist increasing in line with at-the-money implied volatility.
Conclusion
The volatility term structure is a useful indicator of significant equity market risk. Because equity market risk can be transitory, or can last for months or even longer, it is useful to categorize historical experience by the shape of the volatility surface and by VIX futures. The history of changes in the VIX Index and of VIX futures falls into four categories of Classic Crisis, Transitory, Continuing High Volatility and Tranquility. We are currently in a period of Continued High Volatility that started in early 2020.
[1] I wish to thank my partner Leslie Rahl and my associate, Emily Liu for their assistance in the preparation of this manuscript.
[2] See Carr, Peter, May 2017, Why is VIX a fear gauge?, Risk and Decision Analysis 6(2): 179-185.
[3] The risks addressed here by the VIX and VIX futures are solely the risks affecting the SPX and don’t include other regulatory risks or risks to other markets.
[4] The VXO, which reported the implied volatility on options on the OEX or S&P100, is shown before the VIX started in 1990.
[5] Lehman’s bankruptcy was on September 15, 2008.
[6] Skew is shown here by the percentage increase in the implied volatility of seven-month put options struck 20% out-of-the-money compared to the implied volatility of similar at-the-money options.